

Personal computing and printing company HP (NYSE:HPQ) reported Q2 CY2025 results exceeding the market’s revenue expectations, with sales up 3.1% year on year to $13.93 billion. Its non-GAAP profit of $0.75 per share was in line with analysts’ consensus estimates.
Is now the time to buy HP? Find out by accessing our full research report, it’s free.
HP (HPQ) Q2 CY2025 Highlights:
- Revenue: $13.93 billion vs analyst estimates of $13.76 billion (3.1% year-on-year growth, 1.2% beat)
- Adjusted EPS: $0.75 vs analyst estimates of $0.75 (in line)
- Adjusted EBITDA: $1.12 billion vs analyst estimates of $1.17 billion (8.1% margin, 4.4% miss)
- Adjusted EPS guidance for Q3 CY2025 is $0.92 at the midpoint, roughly in line with what analysts were expecting
- Operating Margin: 5.1%, down from 7% in the same quarter last year
- Free Cash Flow Margin: 10.4%, up from 9.3% in the same quarter last year
- Market Capitalization: $25.37 billion
Company Overview
Born from the legendary Silicon Valley garage startup founded by Bill Hewlett and Dave Packard in 1939, HP (NYSE:HPQ) designs and sells personal computers, printers, and related technology products and services to consumers, businesses, and enterprises worldwide.
Revenue Growth
Examining a company’s long-term performance can provide clues about its quality. Any business can have short-term success, but a top-tier one grows for years.
With $54.71 billion in revenue over the past 12 months, HP is a behemoth in the business services sector and benefits from economies of scale, giving it an edge in distribution. This also enables it to gain more leverage on its fixed costs than smaller competitors and the flexibility to offer lower prices. However, its scale is a double-edged sword because it’s harder to find incremental growth when you’ve penetrated most of the market. To accelerate sales, HP likely needs to optimize its pricing or lean into new offerings and international expansion.
As you can see below, HP struggled to increase demand as its $54.71 billion of sales for the trailing 12 months was close to its revenue five years ago. This shows demand was soft, a poor baseline for our analysis.
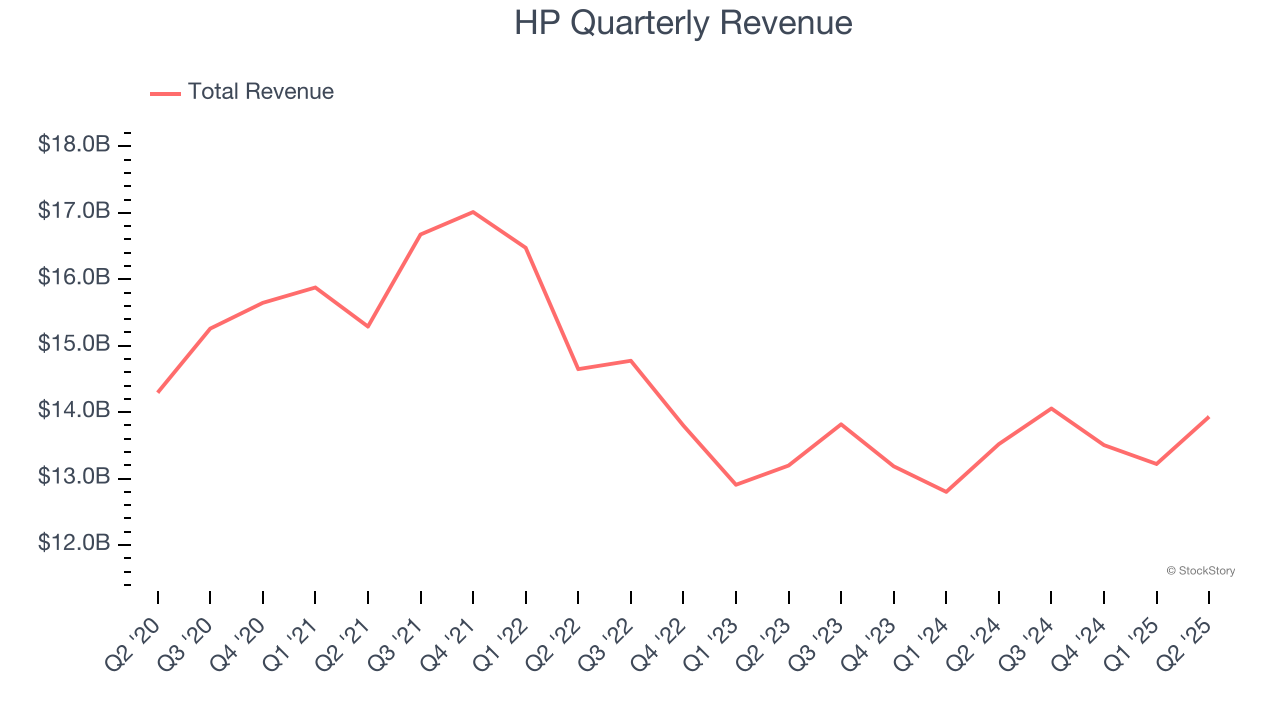
Long-term growth is the most important, but within business services, a half-decade historical view may miss new innovations or demand cycles. Just like its five-year trend, HP’s revenue over the last two years was flat, suggesting it is in a slump. 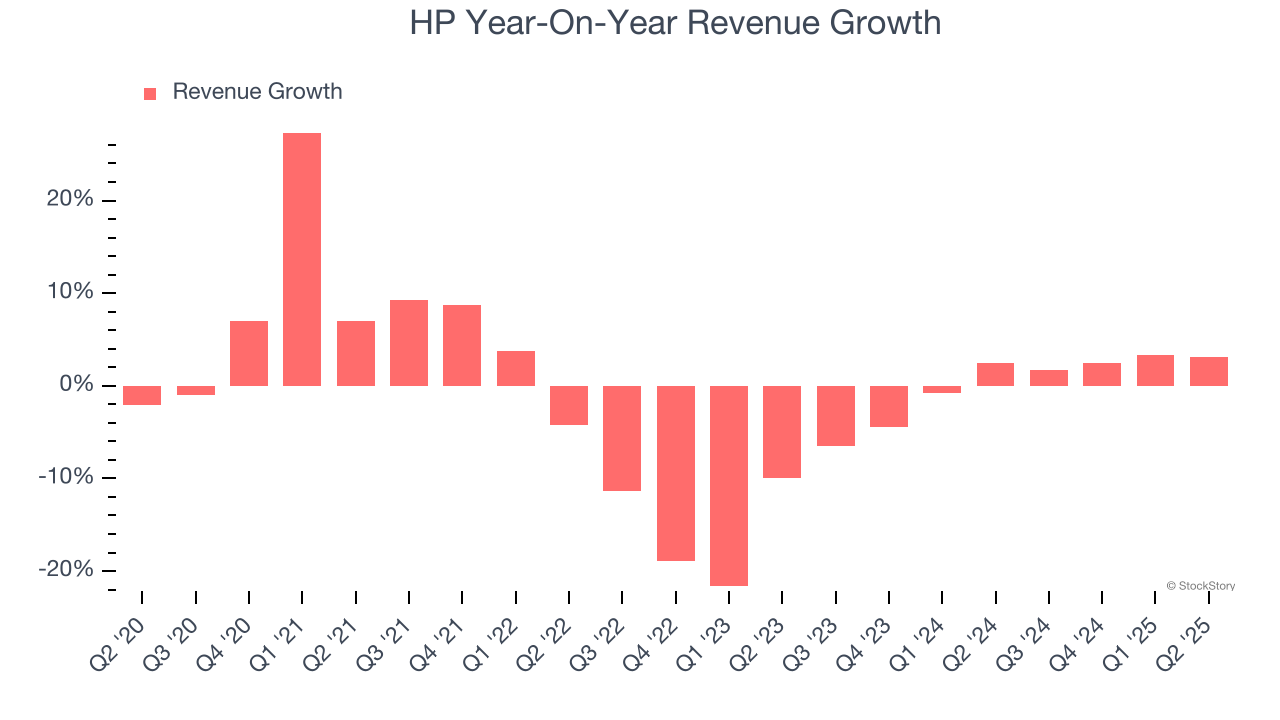
We can dig further into the company’s revenue dynamics by analyzing its most important segments, Commercial Personal Systems and Commercial Printing, which are 50.5% and 28.6% of revenue. Over the last two years, HP’s Commercial Personal Systems revenue (desktops, laptops, etc.) averaged 3.2% year-on-year growth. On the other hand, its Commercial Printing revenue (commercial or industrial printers) averaged 3.5% declines. 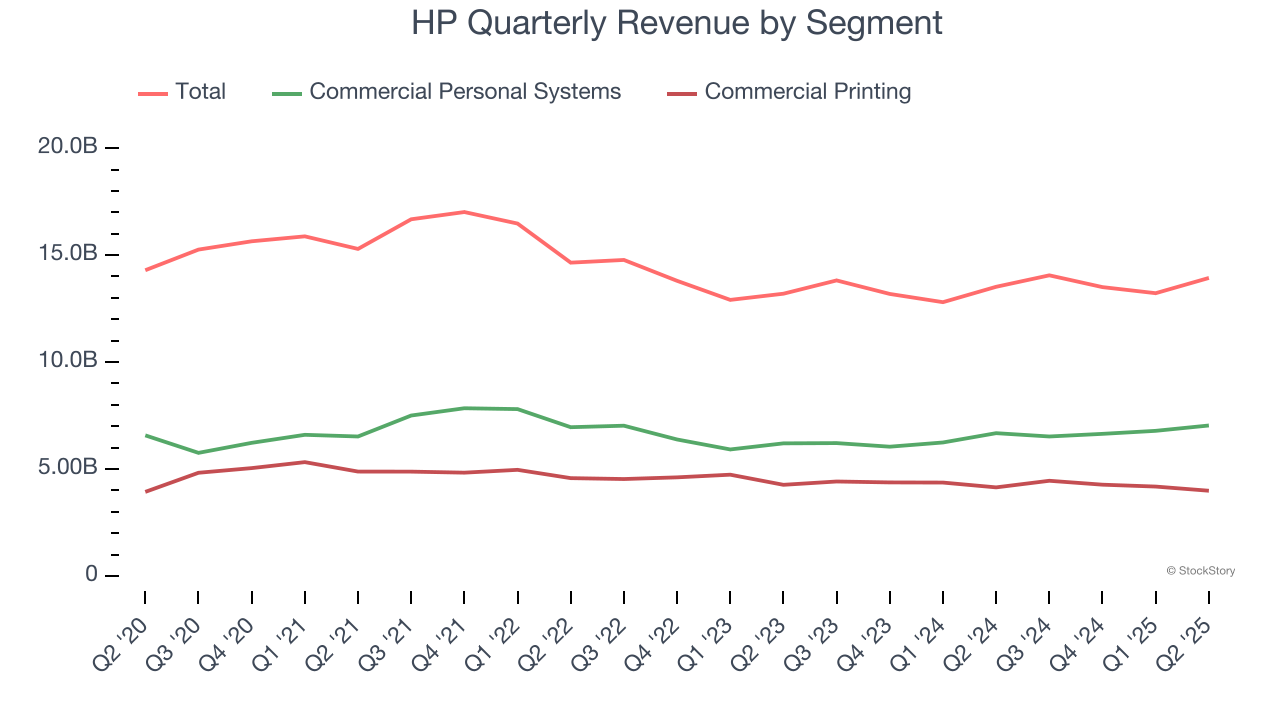
This quarter, HP reported modest year-on-year revenue growth of 3.1% but beat Wall Street’s estimates by 1.2%.
Looking ahead, sell-side analysts expect revenue to grow 1.1% over the next 12 months, similar to its two-year rate. While this projection implies its newer products and services will fuel better top-line performance, it is still below average for the sector.
Software is eating the world and there is virtually no industry left that has been untouched by it. That drives increasing demand for tools helping software developers do their jobs, whether it be monitoring critical cloud infrastructure, integrating audio and video functionality, or ensuring smooth content streaming. Click here to access a free report on our 3 favorite stocks to play this generational megatrend.
Operating Margin
Operating margin is one of the best measures of profitability because it tells us how much money a company takes home after subtracting all core expenses, like marketing and R&D.
HP was profitable over the last five years but held back by its large cost base. Its average operating margin of 7% was weak for a business services business.
Analyzing the trend in its profitability, HP’s operating margin decreased by 2.3 percentage points over the last five years. HP’s performance was poor no matter how you look at it - it shows that costs were rising and it couldn’t pass them onto its customers.
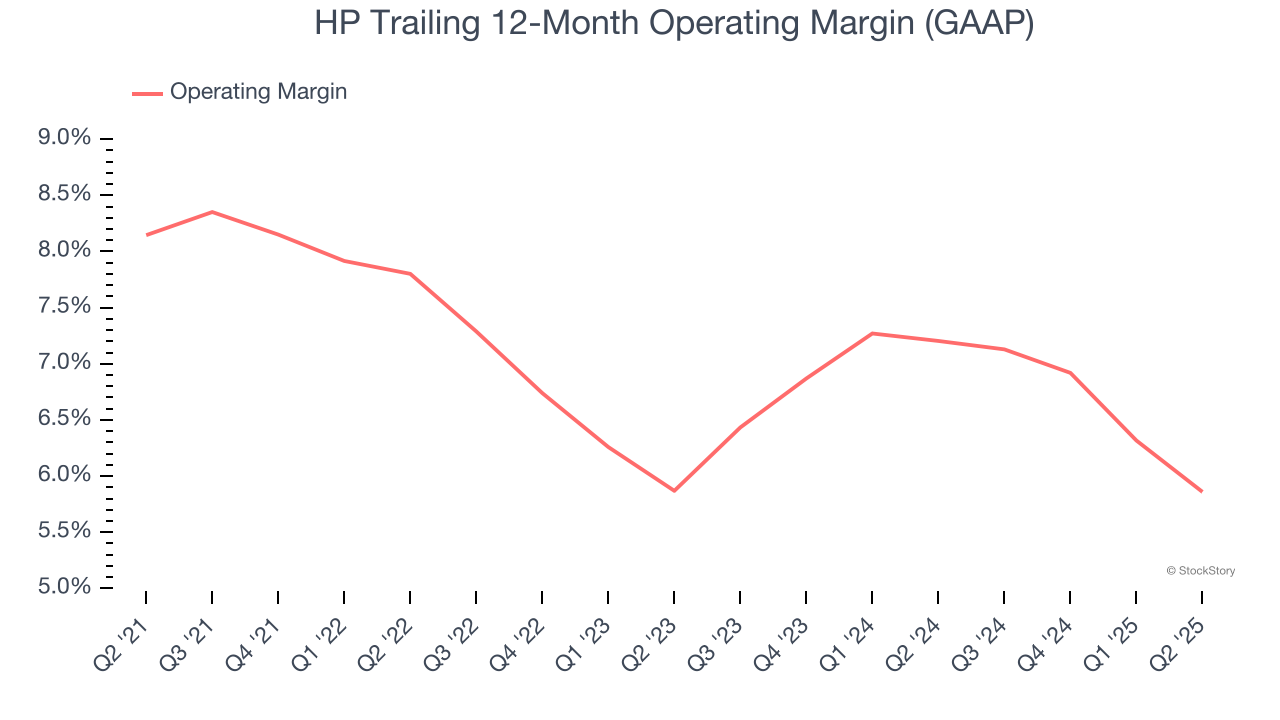
In Q2, HP generated an operating margin profit margin of 5.1%, down 1.8 percentage points year on year. This reduction is quite minuscule and indicates the company’s overall cost structure has been relatively stable.
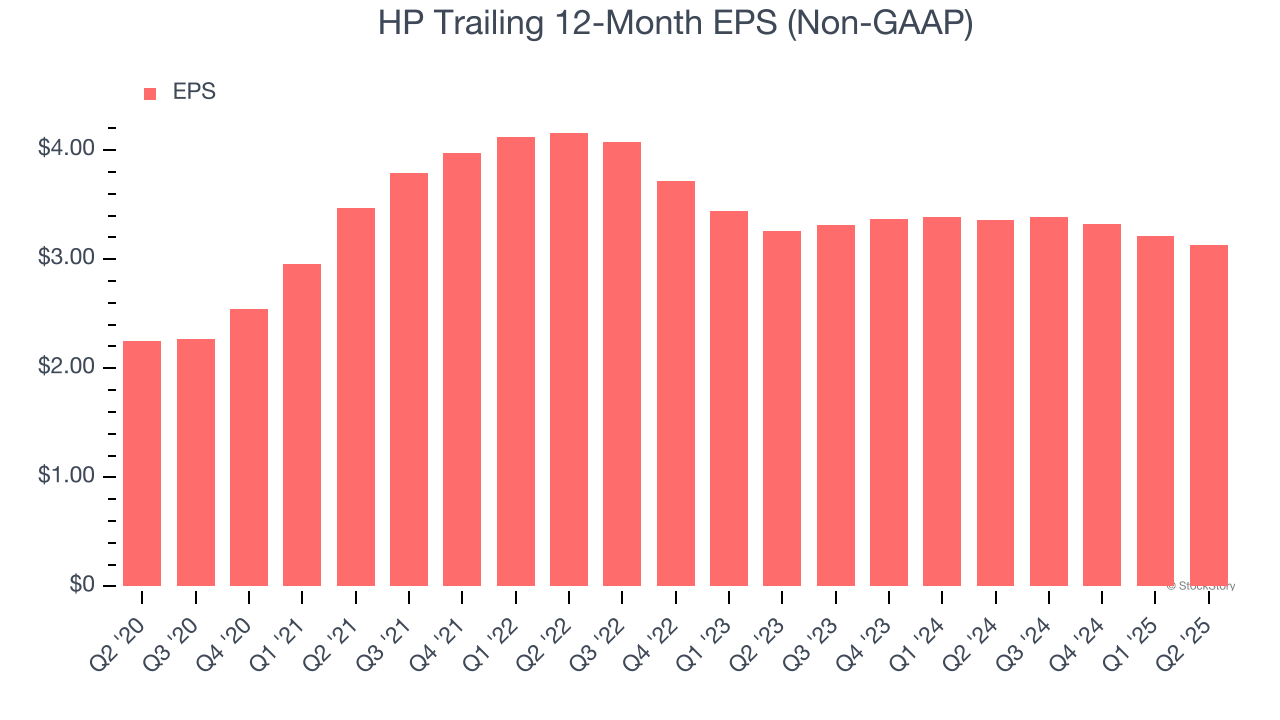
Earnings Per Share
We track the long-term change in earnings per share (EPS) for the same reason as long-term revenue growth. Compared to revenue, however, EPS highlights whether a company’s growth is profitable.
HP’s EPS grew at an unimpressive 6.8% compounded annual growth rate over the last five years. This performance was better than its flat revenue but doesn’t tell us much about its business quality because its operating margin didn’t improve.
We can take a deeper look into HP’s earnings to better understand the drivers of its performance. A five-year view shows that HP has repurchased its stock, shrinking its share count by 33%. This tells us its EPS outperformed its revenue not because of increased operational efficiency but financial engineering, as buybacks boost per share earnings. 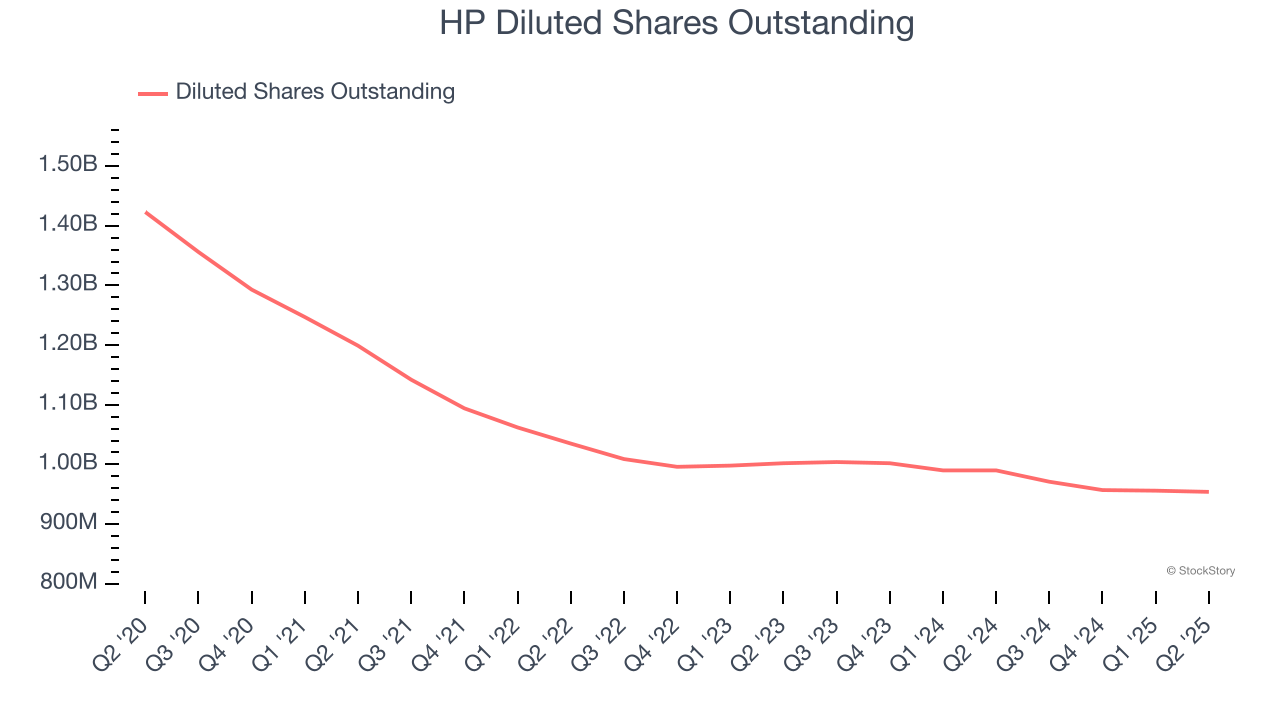
Like with revenue, we analyze EPS over a more recent period because it can provide insight into an emerging theme or development for the business.
For HP, its two-year annual EPS declines of 2% show it’s continued to underperform. These results were bad no matter how you slice the data.
In Q2, HP reported adjusted EPS of $0.75, down from $0.83 in the same quarter last year. This print was close to analysts’ estimates. Over the next 12 months, Wall Street expects HP’s full-year EPS of $3.13 to grow 6.9%.
Key Takeaways from HP’s Q2 Results
It was good to see HP narrowly top analysts’ revenue expectations this quarter. On the other hand, EPS was in line, as was EPS guidance for next quarter. Zooming out, we think this was a quarter without many surprises. The stock remained flat at $26.89 immediately following the results.
Big picture, is HP a buy here and now? The latest quarter does matter, but not nearly as much as longer-term fundamentals and valuation, when deciding if the stock is a buy. We cover that in our actionable full research report which you can read here, it’s free.