
Cloudflare (NET) may present an intriguing canvas for options traders interested in speculative ideas, as broader fears affecting the technology ecosystem have led to an erosion in market value. Essentially, the fear is that the low-hanging fruit of artificial intelligence has already been plucked. Therefore, the rising capital expenditures toward AI carry significant risks. With NET stock having already moved up about 54% in the trailing year, many investors simply hit the exits.
Still, Cloudflare issued a competing narrative at a recent tech conference. Specifically, the leadership team warned of a “technical glass ceiling” that awaits those enterprises that fail to modernize their applications and infrastructure. Sure, there are legitimate concerns about excessive spending on machine intelligence. At the same time, the innovation is only accelerating, meaning that those who refuse to get on board risk sticking themselves into an outdated paradigm.
Of course, narratives alone aren’t going to save NET stock if not enough people believe in them. Right now, the Barchart Technical Opinion indicator rates the stock as a 56% Sell, indicating broader pessimism. Further, the options market doesn’t exactly offer the most convincing framework at this moment.
Looking at options flow, which focuses exclusively on big block transactions, the general sentiment is bullish. However, among the sessions last week that featured the highest dollar amount of bullish sentiment trades, the lion’s share of transactions was represented by sold puts. Ideally, you’d like to see more debit-based directional wagers, which just wasn’t the case last week.
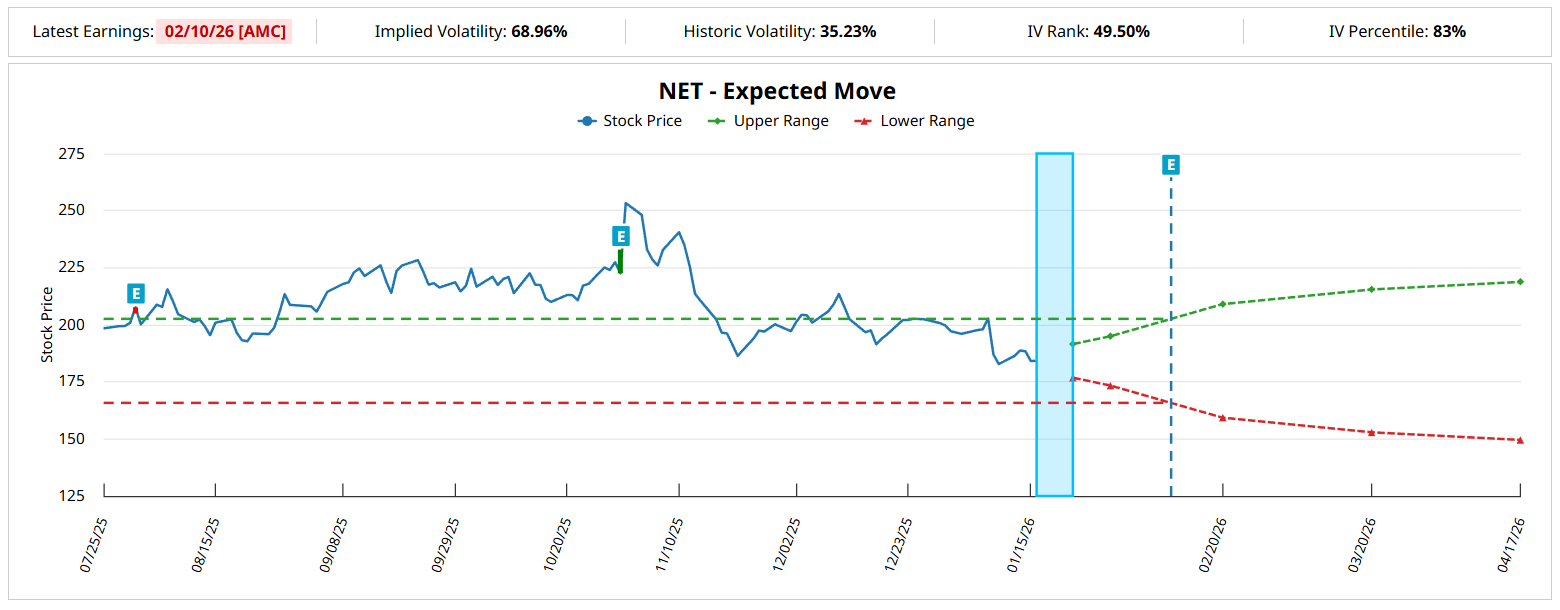
Still, implied volatility (IV) over the future options chains seems relatively elevated, indicating a higher potential for kinetic swings. For example, IV for the March 20 expiration date currently stands at 58.74%. When plugged into the Black-Scholes formula, the expected dispersion would place NET stock between $152.89 and $215.45, assuming a spot price of $184.17 (Friday’s close).
In other words, NET stock is expected to move quite robustly. It’s just a matter of figuring out where.
Using the Markov Property to Narrow Down the List of Probabilities for NET Stock
As elegant of a formula as the Black-Scholes model is, the mathematical reality is that it represents a first-order analysis. Basically, if we grant the presupposition that volatility is an independent phenomenon (meaning that it is not influenced by prior contexts) and that forward returns are lognormally distributed, then we can reasonably infer that the modeled output is an optimal reflection of market dynamics.
However, both reality and lived experience confirm that such a presupposition cannot be made. Instead, the market operates under the Markov property, which claims that the future (behavioral) state of a system depends solely on the current state. In a practical sense, the Markovian framework asserts that prior contexts will influence how the market plays out in the future.
This is a very reasonable deduction. For example, a 25-yard field goal in football is a chip shot. However, if a Super Bowl title is on the line and the game is being played in inclement conditions, that’s a context that will almost certainly influence the probability of the kicker converting the effort. It’s the same principle in the financial market.
Under normal conditions, a long position in NET stock held for 10 weeks would typically land between $170 and $230 (again, assuming a spot price of $184.17). However, in the last 10 weeks, NET has printed only four up weeks, leading to an overall downward slope. This 4-6-D sequence will statistically tend to have a different set of outcomes relative to other sequences.
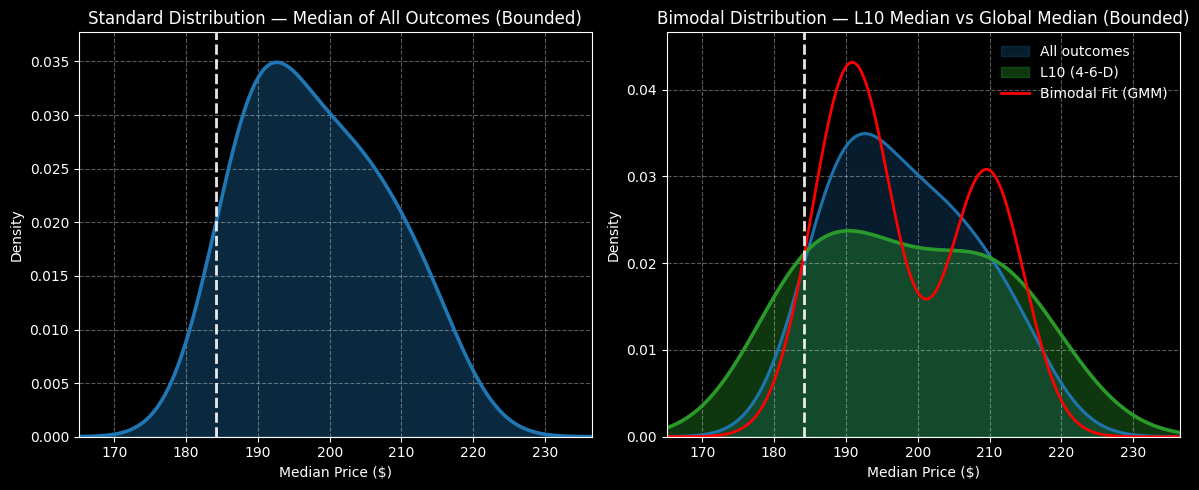
Specifically, the range of outcomes expands to $160 and $240. However, the beauty of the Markovian second-order analysis comes in the form of probability density. Under 4-6-D conditions, density will be greatest between $183 and $211. Under aggregate conditions, density is narrower, landing between $190 and $200.
In other words, the reward tail under 4-6-D conditions extends further out, facilitating a more bullish posture. Further, the Markov property allows us to focus on a narrower set of probabilities, thus making our trading endeavors more efficient.
Putting Theory into Practice
With the market intelligence above, the trade that arguably makes the most sense is the 200/210 bull call spread expiring March 20, 2026. This wager involves two simultaneous transactions: buy the $200 call and sell the $210 call, for a net debit paid of $455 (the most that can be lost).
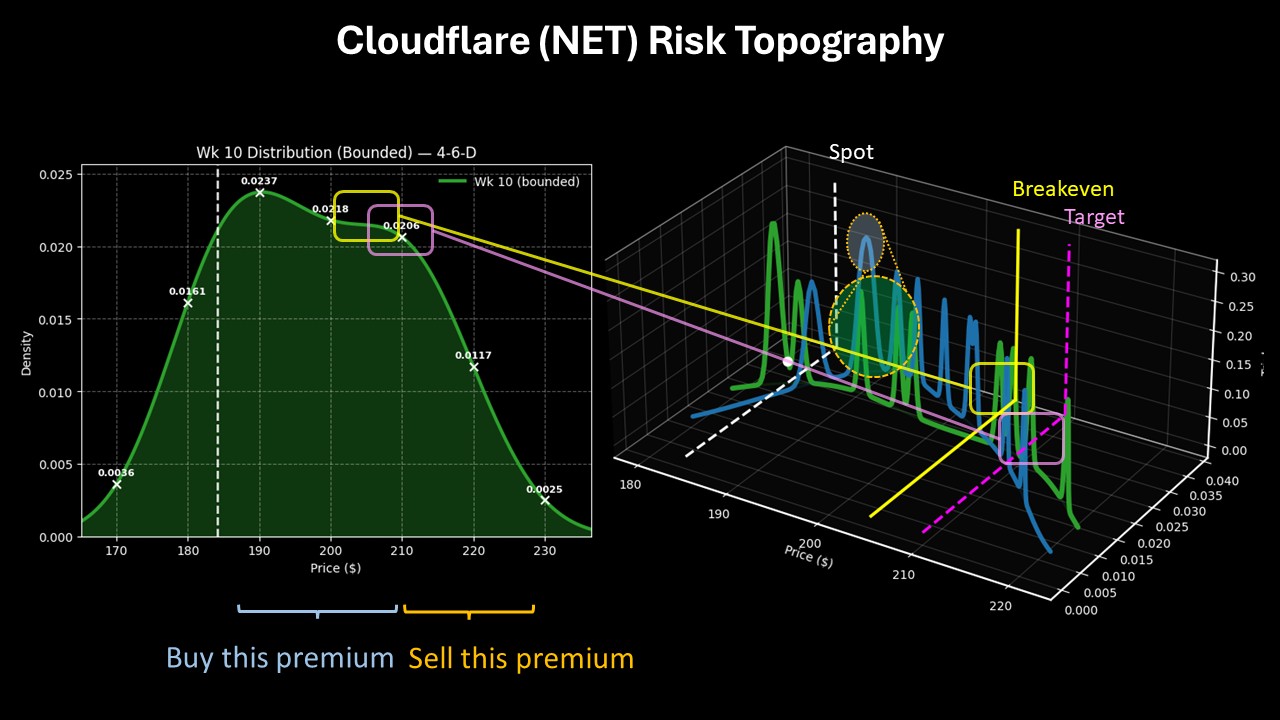
Should NET stock rise through the second-leg strike ($210) at expiration, the maximum profit would be $545, a payout of almost 120%. Breakeven lands at $204.55, adding to the trade’s probabilistic credibility.
What makes this trade enticing is the overall risk topography, which is a three-dimensional view of demand structure. Not only does the 200/210 bull spread align optimally with the expected price and probability density, it also takes into account population frequency. Essentially, we would expect a high trial count at the $210 price point if we looked at the 4-6-D sequence hierarchically.
Still, the bottom line is that implied volatility data for the March 20 options chain shows a high level of expected movement. What we’re doing with the Markov property is to narrow the list of suspects down. Therefore, rather than a straddle-type trade (that would be awfully expensive), we’re going with a directional wager, which is justified by the math and is more optimally considerate.
On the date of publication, Josh Enomoto did not have (either directly or indirectly) positions in any of the securities mentioned in this article. All information and data in this article is solely for informational purposes. For more information please view the Barchart Disclosure Policy here.
More news from Barchart
- Up 17% in Just 5 Days: Is a Simple Name Change Really Driving This Stock’s Surge?
- Why Cloudflare (NET) Stock Options Could Be Due for a Comeback Trade
- Is Amazon Too Cheap Ahead of Earnings? Put Yields are High, Implying AMZN Stock Could Rally
- What This $2M Options Bet on Corporate Bonds is Saying About the 10-Year Yield Curve